Annual Report 2014 > Management Strategy and Achievements > Financial Highlights
- Management Strategy and Achievements
Financial Highlights
For the years ended March 31
We have prepared consolidated financial statements in accordance with U.S. GAAP for 2010 or earlier and International Financial Reporting Standards ("IFRSs") for 2011 or later.
For detailed financial information, please refer to the Financial Section of our Annual Report.
Financial Section (610KB/PDF)
Excel File Download (33KB/XLS)
| AA Plan | AG Plan | GG Plan | FOCUS' 10 | ƒ(x) | BBBO2014 | ||||||
|---|---|---|---|---|---|---|---|---|---|---|---|
| 2004 | 2005 | 2006 | 2007 | 2008 | 2009 | 2010 | 2011 | 2012 | 2013 | 2014 | |
| Results of operations: | |||||||||||
| Gross profit | ¥ 501.3 | ¥ 563.1 | ¥ 706.6 | ¥ 857.7 | ¥ 934.5 | ¥ 935.2 | ¥ 779.5 | ¥ 864.0 | ¥ 918.8 | ¥ 827.0 | ¥ 894.4 |
| Financial income (expense) | 0.6 | (2.3) | (9.5) | (23.0) | (27.6) | (21.5) | (12.8) | (8.1) | (3.9) | (2.3) | (2.6) |
| Interest expense, net | (6.4) | (8.6) | (20.0) | (37.1) | (42.8) | (36.1) | (24.1) | (18.1) | (15.1) | (15.8) | (17.4) |
| Dividends | 6.9 | 6.4 | 10.4 | 14.1 | 15.3 | 14.6 | 11.3 | 10.0 | 11.2 | 13.4 | 14.9 |
| Share of profit of investments accounted for using the equity method * | 20.7 | 37.4 | 51.4 | 70.3 | 56.9 | 90.0 | 76.1 | 95.6 | 110.6 | 107.4 | 126.2 |
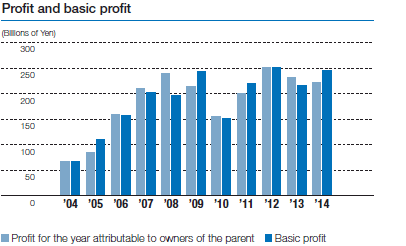
| Profit for the year attributable to owners of the parent * | 66.6 | 85.1 | 160.2 | 211.0 | 238.9 | 215.1 | 155.2 | 200.2 | 250.7 | 232.5 | 223.1 |
| Financial position at year end: | |||||||||||
| Total assets | 5,012.5 | 5,533.1 | 6,711.9 | 8,430.5 | 7,571.4 | 7,018.2 | 7,137.8 | 7,230.5 | 7,226.8 | 7,832.8 | 8,668.7 |
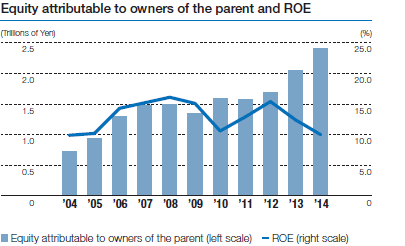
| Equity attributable to owners of the parent * | 730.8 | 934.9 | 1,304.0 | 1,473.1 | 1,492.7 | 1,353.1 | 1,583.7 | 1,570.5 | 1,689.1 | 2,052.8 | 2,404.7 |
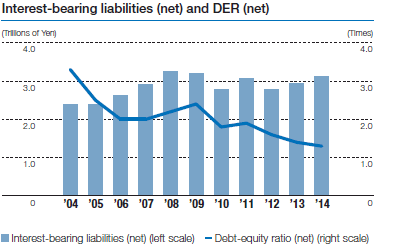
| Interest-bearing liabilities (net) *1 | 2,377.6 | 2,376.0 | 2,622.2 | 2,913.3 | 3,247.6 | 3,186.8 | 2,781.8 | 3,056.3 | 2,786.7 | 2,930.3 | 3,123.5 |
| Cash flows *2: | |||||||||||
| Net cash from operating activities | 61.8 | (19.4) | (60.8) | 194.3 | 323.7 | 348.8 | 510.4 | 219.5 | 190.4 | 280.3 | 278.2 |
| Net cash used in investing activities | 57.9 | (52.7) | (137.9) | (449.7) | (298.0) | (261.5) | (59.4) | (469.4) | (35.7) | (186.2) | (249.9) |
| Free cash flows | 119.7 | (72.0) | (198.7) | (255.5) | 25.6 | 87.3 | 451.0 | (249.9) | 154.7 | 94.1 | 28.4 |
| Net cash (used in) from financing activities | (23.6) | 111.2 | 256.7 | 169.7 | 7.9 | (5.8) | (150.1) | 155.9 | (33.3) | (24.7) | 145.9 |
| AA Plan | AG Plan | GG Plan | FOCUS' 10 | ƒ(x) | BBBO2014 | ||||||
|---|---|---|---|---|---|---|---|---|---|---|---|
| 2004 | 2005 | 2006 | 2007 | 2008 | 2009 | 2010 | 2011 | 2012 | 2013 | 2014 | |
| Amounts per share: | |||||||||||
| Profit for the year attributable to owners of the parent *: | |||||||||||
| Basic | ¥ 62.66 | ¥ 72.83 | ¥ 130.18 | ¥ 169.93 | ¥ 192.51 | ¥ 172.06 | ¥ 124.15 | ¥ 160.17 | ¥ 200.52 | ¥ 185.92 | ¥ 178.59 |
| Diluted | 61.31 | 72.82 | 130.17 | 169.90 | 192.47 | 172.03 | 124.12 | 160.09 | 200.39 | 185.79 | 178.46 |
| Equity attributable to owners of the parent * | 686.99 | 776.61 | 1,047.88 | 1,192.35 | 1,194.20 | 1,082.47 | 1,266.93 | 1,256.31 | 1,351.10 | 1,641.60 | 1,927.37 |
| Cash dividends declared for the year *3 | 8.00 | 11.00 | 25.00 | 33.00 | 38.00 | 34.00 | 24.00 | 36.00 | 50.00 | 46.00 | 47.00 |
| AA Plan | AG Plan | GG Plan | FOCUS' 10 | ƒ(x) | BBBO2014 | ||||||
|---|---|---|---|---|---|---|---|---|---|---|---|
| 2004 | 2005 | 2006 | 2007 | 2008 | 2009 | 2010 | 2011 | 2012 | 2013 | 2014 | |
| Ratios: | |||||||||||
| Equity attributable to owners of the parent ratio (%) * | 14.6 | 16.9 | 19.4 | 17.5 | 19.7 | 19.3 | 22.2 | 21.7 | 23.4 | 26.2 | 27.7 |
| ROE (%) | 9.9 | 10.2 | 14.3 | 15.2 | 16.1 | 15.1 | 10.6 | 12.9 | 15.4 | 12.4 | 10.0 |
| ROA (%) | 1.4 | 1.6 | 2.6 | 2.8 | 3.0 | 2.9 | 2.2 | 2.8 | 3.5 | 3.1 | 2.7 |
| Debt-Equity Ratio (net) (times) | 3.3 | 2.5 | 2.0 | 2.0 | 2.2 | 2.4 | 1.8 | 1.9 | 1.6 | 1.4 | 1.3 |
| AA Plan | AG Plan | GG Plan | FOCUS' 10 | ƒ(x) | BBBO2014 | ||||||
|---|---|---|---|---|---|---|---|---|---|---|---|
| 2004 | 2005 | 2006 | 2007 | 2008 | 2009 | 2010 | 2011 | 2012 | 2013 | 2014 | |
| For reference: | |||||||||||
| Total trading transactions *4, 5 | ¥9,197.9 | ¥9,898.6 | ¥10,336.3 | ¥10,528.3 | ¥11,484.6 | ¥10,750.0 | ¥ 7,767.2 | ¥ 8,349.4 | ¥ 8,273.0 | ¥ 7,502.7 | ¥ 8,146.2 |
| Basic profit *6 | 66.8 | 110.0 | 158.3 | 202.9 | 197.1 | 243.0 | 151.4 | 220.5 | 251.5 | 216.5 | 245.0 |
- *
- Under U.S. GAAP, "Share of profit of investments accounted for using the equity method" corresponds to "Equity in earnings of associated companies, net," "Profit for the year attributable to owners of the parent" corresponds to "Net income attributable to Sumitomo Corporation," "Equity attributable to owners of the parent" corresponds to "Sumitomo Corporation shareholders' equity" and "Equity attributable to owners of the parent ratio" corresponds to "Sumitomo Corporation shareholders' equity ratio."
- *1
- Interest-bearing liabilities (net) excludes cash and cash equivalents and time deposits from interest-bearing liabilities.
- *2
- Except for 2004, the prior year amounts of cash flow are reclassified to conform to ASC 810 "Consolidation."
- *3
- Cash dividends per share represents the cash dividends declared applicable to each respective year, including dividends paid after the year-end.
- *4
- Total trading transactions is presented in a manner customarily used in Japan solely for Japanese investors' purposes.
- *5
- Total trading transactions represents the gross transaction volume of trading activities, or the nominal aggregate value of the transactions for which the Companies act as a principal or as an agent. Total trading transactions is a measure commonly used by Japanese trading companies. It is not to be construed as equivalent to, or a substitute for, sales or revenues under accounting principles generally accepted in the United States of America ("U.S. GAAP") or IFRSs.
- *6
- Basic Profit = (Gross profit + Selling, general and administrative expenses (excluding provision for doubtful receivables) + Interest expense, net + Dividends) x (1 - Tax rate) + Share of profit of investments accounted for using the equity method
<Tax rate was 42% for 2004, 41% for 2005 through 2012 and 38% for 2013 and 2014.>


